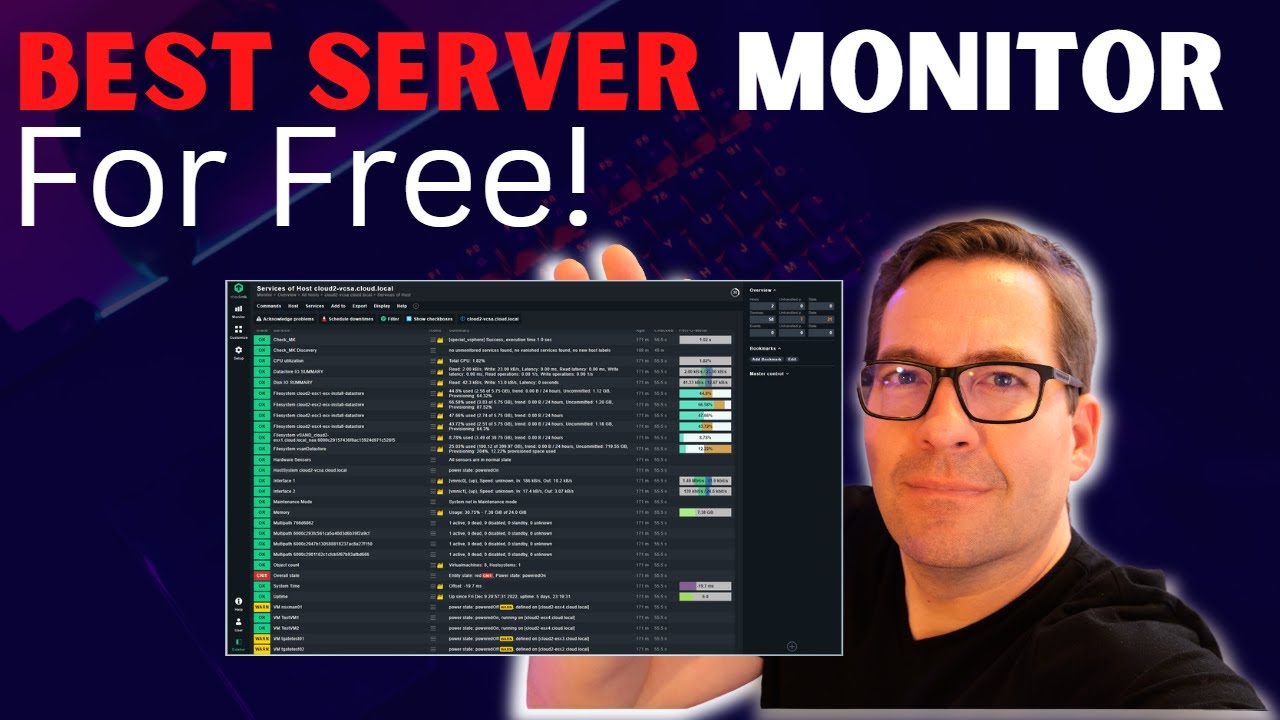
Best Server & Application Monitor for free with Checkmk
Monitoring is an essential part of making sure self-hosted services are up and running and performance is as expected. Checkmk Raw edition provides a free and open source server & application monitor you can spin up in seconds in a Docker container.
Subscribe to the channel: https://www.youtube.com/channel/UCrxcWtpd1IGHG9RbD_9380A?sub_confirmation=1
My blog:
https://www.virtualizationhowto.com
_____________________________________________________
Social Media:
Tweets by vspinmaster
LinkedIn:
https://www.linkedin.com/in/brandon-lee-vht/
Github:
https://github.com/brandonleegit
Introduction to monitoring – 0:00
Discussing the importance and benefits of monitoring – 0:53
Introduction to Checkmk free and open source solution – 1:54
Discussing the Checkmk Raw edition and installation options – 2:36
You can run it in a Docker container – 3:00
Difference between the Raw edition and Free edition – 3:30
How to deploy Checkmk using a Docker container – 4:42
Discussing the Docker command for the Checkmk container – 5:19
Running the Docker command – 5:52
Checking the Docker container – 6:10
Container logs show the initial password for Checkmk – 6:27
Discussing the next steps for configuration – 6:58
Logging into Checkmk web interface – 7:21
Adding a host monitoring rule for monitoring VMware – 7:35
Entering credentials and setting SSL checking – 7:58
Adding the vCenter Server as a host to monitor after setting up host rule – 8:18
Service discovery for the vSphere environment – 8:41
Accepting the services for monitoring VMware environment – 9:03
Committing changes in the environment – 9:19
Checkmk querying services for status and analytics – 9:39
Looking at the services and monitoring with Checkmk – 10:10
Perf-o-meter with Checkmk – 10:54
Looking at the cloud monitoring options – 11:11
Docker container host monitoring – 11:30
Monitoring for Docker hosts and metrics – 11:41
Wrapping up and talking about notifications, etc – 12:00
by VirtualizationHowto
linux web server


Can this detect any documents that have been updated on server.
Branden your a legend.your videos are always informative and fun for noobs.cheers ….
anybody use Wazuh?
It has a proprietary dashboard. Without the dashboard it's the worst of the open source solutions
Hi,
can I install checkmk after I have the whole stack up & running (running website)?!
Thank you
This guy is such a chad
Fantastic video, thanks.. For some reason, I've always avoided CheckMK, feeling Zabbix etc would be better, but actually this has been a much smoother experience.
@VirtualizationHowTo —-> Do you know if CheckMK integrate with Graphana?
checkmk is great ! so, lt's talk about zbx
Dynatrace is better. But it's far from free.
Check_mk is just an overlay for nagios. You can also simply run standard nagios as well. Personally i think icinga2 is much nicer as it's got all the same capabilities under the hood but seems to be much less resource intensive than check_mk, nagios, and nagios xi.
good one but it would be good if you touch about alerts!!! does it have an option to integrate slack/telegram for any event triggered in raw version?
I use NetXMS
@8:06 You should mention adding an explicit host argument otherwise this rule will apply to all hosts you attempt to add. Took me a day of troubleshooting to figure out what was wrong.
solarwinds is what i use…but for free you should try observium
Your stating that Checkmk is the best monitoring, but provide not a single argument how it is better than for example Zabbix…
Oh my god you look like Chris Stuckmann that was the reason I clicked on the video lol. But nice content and you have new subscriber.
soo cool video!! thnx!
I dont know, I will still choose zabbix for server monitoring. But it's been a while when I used this typy of monitoring tools.
Obsolete.
Nice, thanks. I tried the free/enterprise appliance and it was able to talk to my single esxi host (no central vCenter). Looks like there's no raw version for the appliance so I'll probably redo things using the docker version so I can get onto the raw. Adding hosts initially wasn't intuitive, but your video was very helpful in figuring things out.
Nice and interesting video about Checkmk. I worked with this solution for quite a while and I agree that it's easy to to setup and get some quick results. But if you're dealing with bigger environments, then the command line has to be your friend. A very interesting free solution, which I like better, is Zabbix. Please have a look and make a comparison, I'd be interested, if you agree.
You should have a look at LibreNMS 😉
The licensing was confusing at first.
You are correct. The Raw version didn’t say anything about unlimited but it is.
CheckMK Raw is open source and self hosted.
CheckMK itself is different than Raw.
It is free for 25 hosts after 30 day trial.
I love Checkmk, easy installation, autodiscovery… Way smoother and more complete than nagios, zabbix, Prtg…
Checkmk is based on nagios – which I've been using for some 15+ years and am happy with. nice though they have a container. tried nagios xi but found that i worked better editing config files manually after being so used to core
Nice video! A question, it's compatible with Oracle Cloud instances? Thanks!
I tried this with 2.0 but I couldnt figure out how to monitor Unraid with it. Has anyone come up with a plugin for it? I also now get an error saying cant create user when I look at the logs.
thanks for the demo and info, have a great day
It sounds like you are banging on your microphone or desk about every ten seconds. It’s a deep thud. Kind of distracting. Otherwise, very interesting video.
Do you need to use vsphere? or can you use this on a straight ESXi server?
Nagios/CheckMK/Opsview/etc are OK. Zabbix really opened my eyes with how much better their detection and trigger system is.
checkmk not free at all there is limitation if you are using free version, zabbix still the best for open source monitoring tools.
Did you get a chance to compare CheckMK against Zabbix by chance? It has zero limitations and has the same functionality for users with and without support agreements.
Did you notice anything for raw snmp?
Enjoyed the video but seems to be missing the DB store component. Monitoring systems need to store the data somewhere which includes storage maintenance. A very key component to any monitoring server/service. Perhaps this concern is outside the scope of the video, but I felt that it should have been covered at least briefly
Would be nice to see a comparison with Zabbix.
Nice video, I remember you mentioning HashiCorp Vault in one of your videos. Do you use it in your homelab? If so, would you ever make a video about it? There actually aren't that many videos about how to configure it on docker
you can run Zabbix on docker too! and its opensource
yeah…. no… problem with all these "free" stuff as per monitoring is that at some point they run so slow that you simply cannot use them… free nagios to paid nagios zabbix zenoss etc etc… networkchuck channel recently released some umma kama something, sorry do not remember the name which supposed to monitor the network… From what I see, and I have built gazillion of these, prometheus grafana slack and opsgenie is go to option dockerised prom and grafana of course… + some ansible automation to deploy all that… Great video though 🙂
hmm:
### STARTING XINETD
* Starting internet superserver xinetd [ OK ]
### STARTING SITE
Temporary filesystem already mounted
Starting agent-receiver…OK
Starting mkeventd…OK
Starting rrdcached…OK
Starting npcd…OK
Starting nagios…OK <—- this is running in the container…
Starting apache…OK
Starting redis…OK
Initializing Crontab…OK
### STARTING CRON
### CONTAINER STARTED