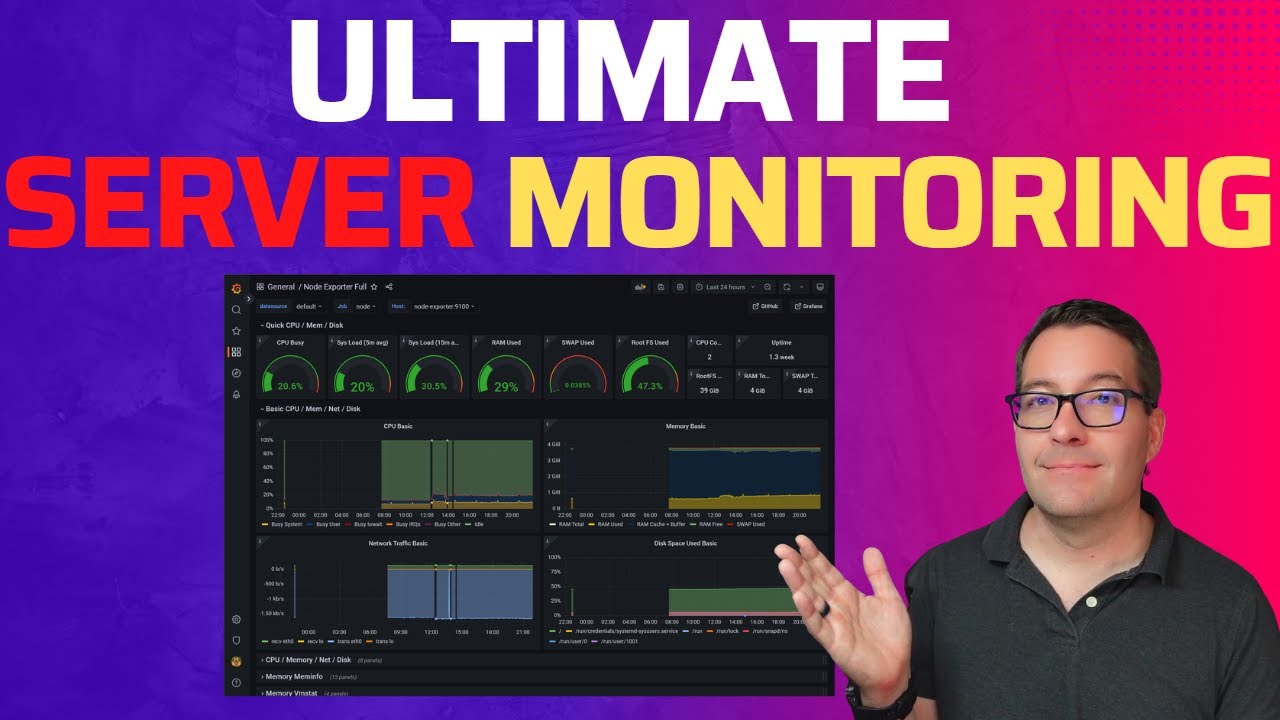
Best Server Monitoring with Prometheus and Grafana using Node Exporter and cAdvisor
A complete walkthrough of completely free and open source solutions to monitor your Linux, Windows, and Docker servers. In the view we see how we can setup and configure Prometheus, Node Exporter, Grafana, and cAdvisor to monitor servers in our environment and how you can easily configure these.
Clone down the examples in this video from the following Git repository:
https://github.com/brandonleegit/OpenSourceMonitoring
Subscribe to the channel: https://www.youtube.com/channel/UCrxcWtpd1IGHG9RbD_9380A?sub_confirmation=1
My blog:
https://www.virtualizationhowto.com
_____________________________________________________
Social Media:
Tweets by vspinmaster
LinkedIn:
https://www.linkedin.com/in/brandon-lee-vht/
Github:
https://github.com/brandonleegit
Introduction to Prometheus, Node Exporter, Grafana, and cAdvisor – 0:00
Looking at how everything fits together – 1:15
Node Exporter details and written for Linux – 2:15
Windows Exporter to expose metrics for monitoring Windows machines – 2:28
cAdvisor for monitoring Docker containers – 2:56
Looking at the Linux host serving as the Docker container host – 3:26
Installing Docker Compose – 3:51
Verifying Docker Compose installation – 4:12
Looking at our Linux user used to run Docker on the Docker host – 4:27
Creating the local folder structure for the local volume mounts – 5:05
Using a crude bash script to create the folder structure – 5:23
Running the command to create the folders – 6:29
Overview of installing the monitoring stack with Docker Compose – 7:08
Editing the Docker Compose file for creating the monitoring stack – 8:03
Stepping through the Docker Compose configuration – 8:18
Talking through permissions and adding the User ID to avoid permissions issues with Prometheus – 9:22
Looking at cAdvisor and odd ports used – 10:47
Redis dependency 11:10
Saving the Docker Compose YAML file – 11:34
Running the Docker Compose UP command – 11:53
The provisioning of the containers finishes, checking everything to see if it is up and running – 12:18
Talking through troubleshooting if a container is crashing – 12:58
Containers are healthy and ready to move forward – 13:13
Talking about configuring Prometheus and getting metrics into Grafana – 13:23
Beginning the configuration of Prometheus – 13:43
Adding configuration to the Prometheus YAML file – 14:18
Stop and start Prometheus container to pick up the new YAML file – 14:43
Browsing out to port 3000 on Docker host to login to Grafana – 15:08
Change your password – 15:18
Navigate to settings and adding a data source – 15:30
Populating the address of our Prometheus installation – 15:48
Save and test the new data source – 16:06
Looking at the Explore dashboard icon – 16:17
Importing a community dashboard – 16:40
Getting the JSON file or ID from the Grafana community dashboards site – 17:00
Downloading the JSON or copy ID to clipboard – 17:30
Paste in the ID of the community dashboard – 17:42
Immediately you see the new dashboard imported to view metrics – 18:15
Looking at Windows Exporter to import metrics from a Windows host – 18:50
Download the Windows Exporter file and copy out to Windows host – 19:16
Running the Exporter installation and viewing Windows Exporter service – 19:30
Adding the Windows Exporter host to our Prometheus configuration – 19:50
Restarting Prometheus to pick up the new Windows host – 20:23
Download a Windows Exporter community dashboard – 20:37
Viewing the new Windows Exporter dashboard and information – 21:18
Talking about adding Docker to monitoring with Prmetheus and Grafana – 21:47
Looking at the Prometheus configuration and the cAdvisor configuration we have in place – 22:04
Concluding and wrapping up thoughts on Prometheus, Node Exporter, Grafana, and cAdvisor – 22:53
A written walkthrough of Prometheus Node Exporter monitoring:
https://www.virtualizationhowto.com/2023/01/prometheus-node-exporter-cadvisor-grafana-install-and-configure/
Best docker containers for Synology NAS:
https://www.virtualizationhowto.com/2023/01/best-docker-containers-for-synology-nas/
by VirtualizationHowto
linux http server


i love this, thanks
Great video!
Does anyone knows how much CPU and memory this monitoring stack uses?
Can we create a metrics to monitor service status like ntpd, chronyd, auditd in Prometheus
nice, But how to monitor VMware ESXI and True Nas Core Storage?
Thank you. It's very helpful.
Not sure if this has been asked already. Can you add how also how install the snmp exporter. Thanks
mkdir: can't create directory '/var/lib/grafana/plugins': Permission denied
how to add target if I have 5 VM running on premise server? Just newbie
How do I add other servers to prometheus? Like 2 linode and a digital ocean server? I'm running prometheus locally, so would i need to create cloudflare tunnels???? Also can you make a video on running grafana and prometheus on trunas?
need some assistance:
Prometheus is up and working, I have node exporters loaded on few server. Prometheus is able to identify them and scrape them.
Installed Grafana and connected to Prometheus but Grafana is not able to show any data in dashboard
any recommendations?
Excellent tutorial. Thanks for this! I'm just getting started with Prometheus and Grafana. Have two questions: 1) Have you seen any dashboards that aggregate Linux, Windows and Docker monitoring into a single (perhaps very simplified) view? 2) Do you have recommendations for alerting? Meaning, if a docker container is reporting as unhealthy, or a specific Linux OS metric is reporting above/below a set threshold, an alert is sent via email/sms to admins…
How do you decided ip address for targets? There is docker ip address too!
I have a question what would the configuration of the exporters and the Prometheus server be like if the servers were AT the company's office and the Prometheus server was AT home.
Basically a remote monitoring. Thanks
First off all thanks for the excellent vidéo it has helped me in my project.
Hello! Perfect tutorial. The only problem for me, where do you get the IP for grafana? Should I go by localhost or I need to find grafana's IP?
Great tutorial! Do you have some guide to read better logs of all containers?
Currently I'm using Dozzle, but I saw some solutions like ELK (Elastic Search, Logstash and Kibana) , any chance to you bring some tutorial to implement in docker-compose?
Hello, great video!
From what I understand Redis is not actual dependency. It is used on the prometheus guide just as "reference container" for examples
Thanks! Looks more pretty than Zabbix.
Hello, i am unable to hit node exporter and cadvisor metrics endpoints via prometheus. It gives me context deadline exceeded error. However when i try to curl it works like charm. Can you please help me with this?
It doesnt seem like grafana can see the nodes i have from cAdvsior. My Docker container dashboard has no data. What steps can I take to troubleshoot this?
nice!!! Very handy!!!
I am having an issue with prometheus. When I try docker-compose up -d there is one error that occurs.
Cannot start service prometheus: failed to create shim task: OCI runtime create failed: runc create failed: unable to start container process: error during container init: error mounting "/root/monitorsvr/prometheus/prometheus.yml" to rootfs at "/etc/prometheus/prometheus.yml": mount /root/monitorsvr/prometheus/prometheus.yml:/etc/prometheus/prometheus.yml (via /proc/self/fd/6), flags: 0x5000: not a directory: unknown: Are you trying to mount a directory onto a file (or vice-versa)?
How to solve this?
a little hint with today docker 23 update 🙂 docker-compose up -d become docker compose up -d – wthout dash in the middle 🙂