How to create a Radar Chart in Windows 11/10
In this post, we are going to show a complete guide to create a Radar Chart in Windows 11/10. A Radar Chart is a kind of 2D chart that is used to plot and display multivariate data in a radial-like structure. It is mainly used to compare the features and characteristics of two or more elements or groups. Now, if you want to create a radar chart on your Windows 11/10 PC, this article is for you. Here, we are going to show you multiple methods that you can use to generate a radar chart without any hassle. Let us check out these methods in detail.
How do I create a circular Radar Chart in Excel?
You can easily create a circular radar chart in Excel. Along with several chart types, Excel also contains the radar chart type for designing radar charts for your datasets. To find out the detailed procedure, read the full article. Here, we have mentioned the step-by-step process to make a radar chart in Excel.
How to create a Radar Chart in Windows 11/10
Here are the methods to create a radar chart on your Windows 11/10 PC:
- Make a radar chart in Microsoft Excel.
- Use dedicated Free Graph Maker to create a radar chart.
- Create a radar chart using a free office suite called SoftMaker FreeOffice.
- Make a radar chart using a free online service.
- Create a radar chart in Google Sheets.
Let us check out the above solutions in detail now!
1] Make a Radar Chart in Microsoft Excel
You can use Microsoft Excel to create a radar chart in Windows 11/10. It is quite easy to do that. Just enter or import your datasets and create a radar chart using the available Chart menu. Let us discuss the exact steps to do so.
How to create a Radar Chart in Microsoft Excel:
Here are the basic steps to generate a radar chart for your dataset in Microsoft Excel:
- Launch the Excel application.
- Create a new dataset workbook or import an existing one.
- Select the dataset you want to plot.
- Go to the Insert tab.
- From the Charts section, click on the Insert Waterfall, Funnel, Stock, Surface, or Radar Chart drop-down option.
- Choose the desired type of radar chart to create it.
- Customize the radar chart.
- Export the workbook with the generated radar chart.
Let us discuss the above radar chart creation steps in an elaborative way.
Firstly, launch the Microsoft Excel application on your PC. And, create or import an existing workbook consists of the input dataset that you want to plot.
Now, select the fields and respective values that you want to graph on the radar chart. Press the Shift button and drag the left mouse click to make the selection.
After that, navigate to the Insert tab from the main ribbon and locate the Charts section. From here, click on the drop-down option called Insert Waterfall, Funnel, Stock, Surface, or Radar Chart. Now, select a radar chart type from simple radar, radar with markers, and filled radar.

As you click on a radar chart type, it will create a radar chart for selected datasets.

You can now customize the radar chart like edit chart title, axis title, format plot area, customize font, and more do more.
When done, you can export the radar chart with an Excel workbook, or you can print the radar chart directly.
Now read: How to create a Calendar in Microsoft Excel
2] Use Free Graph Maker to create a Radar Chart

Free Graph Maker is a dedicated third-party utility that lets you create different types of graphs including radar charts. It is a very simple software that lets you enter the dataset manually and then click on the desired chart type to plot it. Here is a step-by-step procedure to do so:
- Download and install Free Graph Maker.
- Launch the software.
- Enter the datasets in the given fields.
- Select the desired color to plot the value.
- Click the Radar option to generate a radar chart.
- Save the chart to an image or print it.
Firstly, you need to download and install the Free Graph Maker software. It is very lightweight and weighs around 2Mb. After installation, launch the software.
It provides a grid to enter up to 12 different values. Just enter the values with the respective description in the fields.
After that, click on the Radar option and it will generate a radar chart for the entered dataset. You can then save the radar chart to a JPG image or directly print the graph.
If you want to create a basic radar chart, this one is a good option. You can download this handy software from here.
Now read: Best Free Online Gantt Chart Maker Tools
3] Create a Radar Chart using a free office suite called SoftMaker FreeOffice
You can also try this free office suite called SoftMaker FreeOffice to generate a radar chart. It is a feature-rich free office software that offers different office applications including TextMaker (document processor), PlanMaker (spreadsheet maker), and Presentations. To create radar and other types of charts in it, you need to use its PlanMaker application. It lest you view, create, edit, analyze, and process spreadsheets in Windows 11/10. Let us check out how you can create a radar chart in it.
How to create a radar chart using SoftMaker FreeOffice in Windows 11/10:
Follow the below steps for generating a radar chart using this free office software:
- Download and install SoftMaker FreeOffice.
- Launch its PlanMaker application.
- Import or create a dataset.
- Select the values you want to plot.
- Go to Insert menu.
- Insert a radar chart frame.
- Customize the chart.
- Save the chart.
Let us elaborate on the above steps now!
Firstly, you need to download and install SoftMaker FreeOffice to use it. After installing it, launch its PlanMaker application from the Start menu.
Now, you can import datasets in CSV, Excel, or any other supported format. Or, you can also manually enter a new dataset in the grid. Then, select the dataset you want to represent on the radar graph.
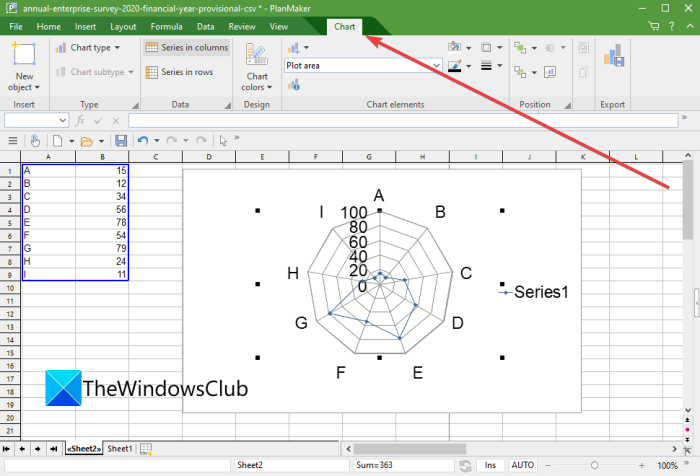
Next, go to the Insert menu and click on the Chart frame drop-down option. From the multiple chart types, select a radar chart type. You can select a radar chart with lines only, a radar chart with lines and markers, or a radar chart with filled area. It will add a radar chart to your spreadsheet.

You can customize various options for the radar chart including line type, line thickness, color, shadow, font, title, and many more. To customize all these and more options, go to the newly added Chart menu.
If you want to save the radar chart as an image in JPEG, PNG, TIF, BMP, and GIF formats.
4] Make a Radar Chart using a free online service
You can also create a radar chart using a free online service. It is easy and convenient to make radar charts online. Just open a web browser, navigate to the chart maker website, enter your dataset, and then create a radar and other charts. These are the web services you can use to make a radar chart:
- onlinecharttool.com
- chachart.net
Let us discuss the above-listed radar chart maker websites.
1] onlinecharttool.com

onlinecharttool.com is a free chart maker website to design a variety of graphs including radar charts. You can create bar, pie, line, area, bubble, scatter, meter, and many more charts. It is quite easy to create a radar chart using this online service.
How to create a Radar Chart online:
Here are the steps to create a radar chart online using this free web service:
- Launch a web browser.
- Open this website.
- Click Design your chart option.
- Select radar chart.
- Add data.
- Customize labels and fonts.
- Preview radar chart.
- Save the radar chart.
Firstly, open the onlinecharttool.com website in a web browser and then click on the Design your chart button from the main interface.
Now, select Radar as the chart type and then enter your dataset manually or import a CSV file. After that, set the font and labels to customize your radar chart. You will then be able to preview the designed radar chart.
Finally, you can save to radar chart to a variety of formats including SVG, PNG, PDF, JPG, and CSV.
2] chachart.net

Another online service that you can use to generate a radar chart is chachart.net. It is a good web service to design radar, pie, and bar charts. You can simply open this web service in your web browser and then enter the graph title. After that, type in your dataset manually in the provided grid. Then, click on the create graph image option and it will create a radar chart on the right-hand side and download it to PC as a PNG image. As simple as that!
5] Create a Radar Chart in Google Sheets

You can also create a radar chart in Google Sheets. It lets you import or create spreadsheets and then generate a radar chart or some other chart for a selected dataset. You can generate a variety of graphs using it such as line, area, Let us check out the detailed radar chart creation process to do so.
How to create a Radar Chart in Google Sheets:
Here are the main steps to make a radar chart in Google Sheets:
- Open Google Sheets.
- Create a new spreadsheet or import an existing one.
- Select the dataset you want to graph.
- Go to the Insert menu.
- Click on the Chart option.
- Select Radar as the chart type.
- Customize the radar graph.
- Save the worksheet.
Firstly, open the Google Sheets and create a new dataset or import a dataset from a local or cloud file. Then, select the cells and values that you want to plot.
Now, click on the Insert > Chart option, and then from the Setup tab, scroll down and select a radar chart type present under the Other category. It will generate a radar chart that you can customize from the Customise tab. You can customize the chart title, chart and axis titles, series, legend, and more.
Finally, you can save the spreadsheet on the cloud or export it to formats like Excel, ODS, PDF, CSV, HTML, etc. You can also print the radar chart.
How do I create a Stock Chart in Excel?
You can create a stock chart in Excel using the same process we discussed for creating a radar chart in Excel earlier in this post. Simply enter your dataset, select the items that you want to plot, and go to the Insert menu. And then, select the Insert Waterfall, Funnel, Stock, Surface, or Radar Chart option and then select a stock chart to create it. Later, you can customize and print the stock chart as per your need.
That’s it! Hope this guide helps you find a suitable solution to create a radar chart in Windows 11/10.
Now read: Best Free Online Flowchart Maker Tools.