How to create an Organization Chart in Excel
If you want to create a chart reporting the relationships in your company or organization, you can create an Organization Chart in Microsoft Excel using the SmartArt graphic feature that provides an Organization Chart layout to build an Organization Chart. The SmartArt graphic feature offered in Microsoft Office can create an Organization Chart in Microsoft Word, PowerPoint, Excel, and Outlook.
What is an Organization Chart?
An Organization Chart is a graphic representation of an organization showcasing the relationships of the positions or the jobs within the organization.
What are the types of organization charts?
The types of organization charts are below.
- Hierarchical Organization Chart: A Hierarchy is where one group or individual is at the top.
- Matrix Organization Chart: This is when individuals have more than one manager
- Flat Organization Chart: As little or no middle management levels usually consist of the administrators and the workers.
How to create an Organization Chart in Excel
To create an Organization Chart in Excel, follow the steps below.
- Launch Excel
- Click the Insert tab
- Click SmartArt in the Illustration group
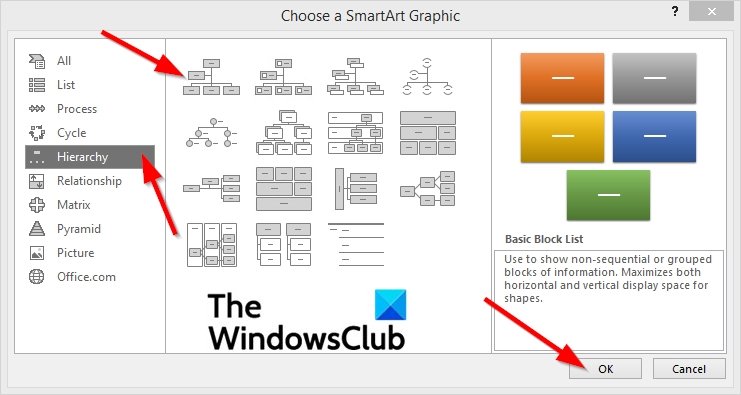
- In the Choose a SmartArt gallery, select Hierarchy
- Click an Organization Chart layout
- Then click OK
- Edit the Organization Chart
- Now we have an organization Chart
Launch Excel.

Click the Insert tab and click the Illustration button and select SmartArt.
A Choose a SmartArt Graphic dialog box will open.
In the Choose a SmartArt gallery, select Hierarchy on the left pane.
Click an Organization Chart layout.
Click OK.
A diagram of the Organization Chart selected will appear on the spreadsheet.
To edit the chart, you can click on the box in the chart and edit your text or click Text in the Text pane to edit the diagram.
Now we have an Organization Chart.
We hope this tutorial helps you understand how to make an Organization Chart.
TIP: You can also create an Org Chart in Google Docs.


