How to make Animated Charts in PowerPoint
A Chart is a diagram or a graphical representation of data in an orderly form. Charts are characterized by symbols such as Bar Charts, Pie Charts, Line, Column, Area, and more. Individuals in businesses, schools, or personal reasons, use Charts for their data, but what if the individual wants to animate their Charts to look more appealing. In this article, we are going to explain the procedure in doing so.
How to Animate Charts in PowerPoint
In PowerPoint, an Animation is a tool that makes objects, pictures, and words to move on a slide. Animation makes your PowerPoint slide unique and presentable according to your design.
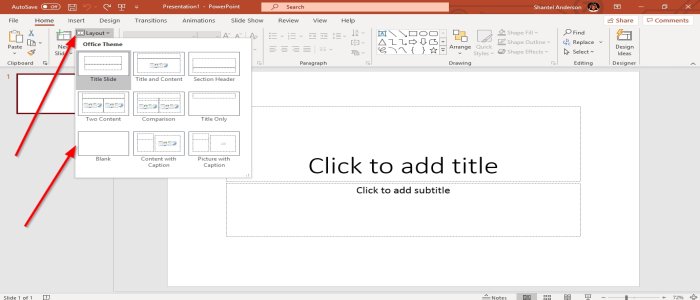
1] You can choose the Layout you want by going to the Home tab and select Layout. In this article, we are using the Blank Layout.

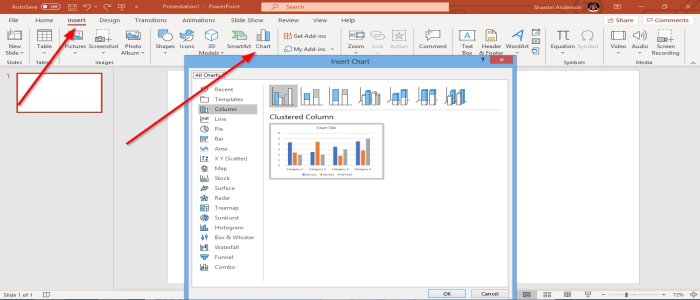
2] Go to Insert, in the illustration group select Chart, the Insert Dialog Box will pop up. We will use the Column, click OK, or create the Chart in Microsoft Excel, then copy the Chart and past it in PowerPoint.

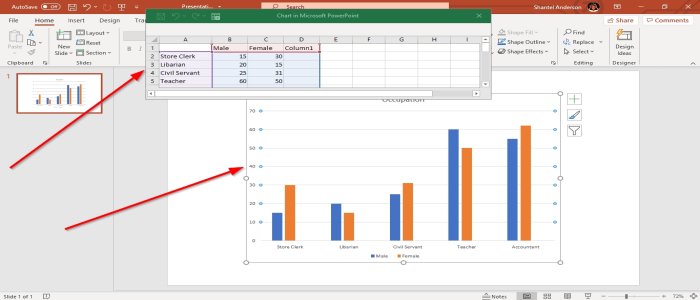
3] A Chart will appear in the PowerPoint slide and a window of an Excel sheet. Edit your data in the Excel sheet.

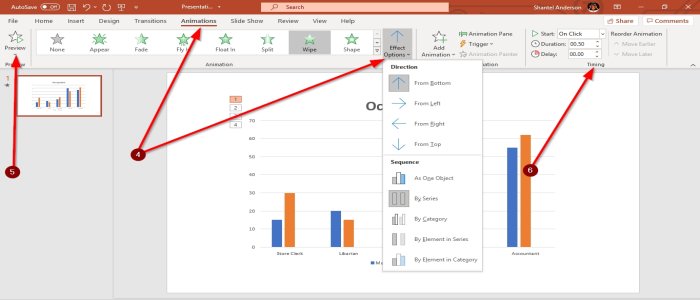
4] Go to the Animations tab, select the animation you want in the Animation Group, and then go to Effect Options, which apply an animation effect to the selected object.
In the drop-down menu of the Effect Option, you can choose Directions where you want the animation to be and the Sequence where you can make the animation of the Charts data by using effects such as By Series, As One Object, By Category, By Element in Series, and By Element in Category. We are going to select By Category in the Sequence list.

5] On the left of the Animation Window, select Preview with a star and a play button symbol. You will see a replay or preview of your Animated Chart.
6] On the Animation Window in the Timing Group, you can modify the Duration.
Read next: How to add animated 3D Graphics to Microsoft Word.
That’s all.


