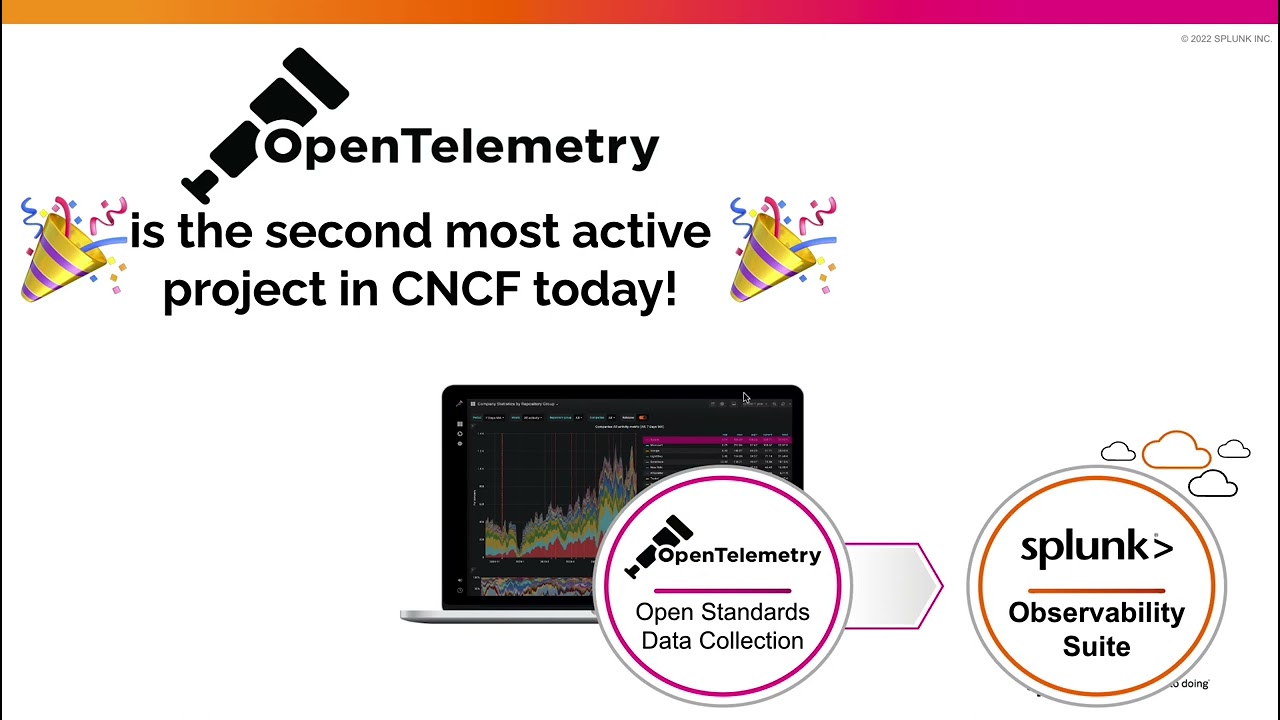
RedHat OpenShift monitoring with Splunk’s OpenTelemetry Operator
Do you have an instant view of all the full-stack automated operations in your OpenShift environment. Would you like to monitor your self-service provisioning as code, to better understand health and performance? Have you been struggling to resolve service issues and reduce the time taken for troubleshooting across all your Kubernetes deployment? We’ve got you covered!
In this talk, we’ll show you how easy it is to get started using the OpenTelemetry Operator to capture metrics, traces and logs. See first hand how you can use out-of-the-box dashboards to automatically track the deployments, nodes, pods and quota utilization across projects in your OpenShift environments with Splunk.
by Splunk
redhat openstack

sound is bad and broken at the end – that is pity because the topic is very interesting
The sound track is broken for me in multiple places